Promoting a Mixture of Housing Options
Author: HLP
Scorecard Categories Addressed
- Community
- Average Household Size
- Balance of Ages
- Housing
- Family Housing
- Older Adult Housing
Solution Description
Existing Neighborhoods Modifying existing neighborhoods is one of the harder challenges for improving the city's housing stock. The following ideas are small scale and should allow existing neighborhoods to evolve over time. For all of these options, there can be too much of a good thing. The recommendation is to limit the density of each housing type.
1. Group housing typically looks like a single-family residence from the outside and located within single-family neighborhoods. Inside, each resident has a private bedroom and possibly a private bathroom. The rest of the house is common space shared by all residents. A certified nurse or care giver may reside on site or visit regularly. Not all zoning codes allow group housing, but allowing group housing will provide more options for older adults.
2. Accessory dwelling units (ADU) allows a 2nd unit to be built on a lot with an existing house. The ADU may house a recent college graduate looking for a job or an elderly parent. ADUs can also be rented to non-family members. Again, not all zoning allows ADUs. However, including ADUs in the housing mix can increase options for families as well as provide additional rental options.
3. ADUs can be taken to the next level by allowing the ADU to be sold independent of the main house. This can provide additional flexibility for the homeowner. To encourage more accessible housing, zoning could allow the minimum lot size to be ½ the current size provided that a "universal design" house built on each ½ lot. This would allow a homeowner in an existing single-family neighborhood to scrap the house, replace with 2 universal design houses, and potentially live in one of the houses while selling the other house to pay off the construction loan.
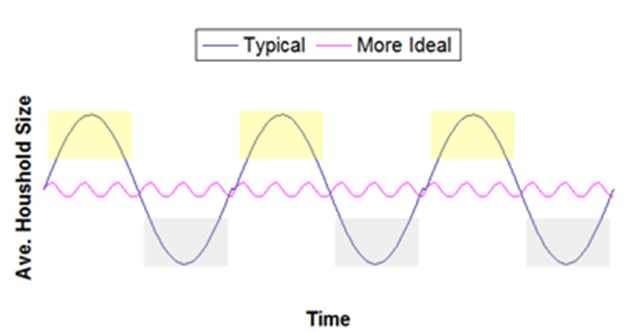
New/Infill Projects For new or larger infill projects, cities could require variety in the housing sizes to help achieve a more constant average household size over time. These new projects present opportunities to make a significant impact on the future direction of the city.
1. For a mixed generational neighborhood, every 3rd or 4th unit should be a different size. For example, if the development is primarily a family neighborhood with 3+ bedroom houses, the "other" houses would be smaller such as patio homes for older adults. The housing mix should attract singles, couples, families with children, and empty nesters.
2. For multi-family units, require a mix of 1, 2, and 3+ bedrooms to accommodate all family sizes. All too often, multi-family is not family-friendly. This needs to change to allow for more affordable family size housing options. Accessibility is big for older adults, so ensuring an adequate mix of accessible units is also very important.
Stakeholder Impact
Families with Young Kids Families will have greater access to the larger (3+ bedrooms) houses and not be prevented from living in the community because of insufficient housing stock. Nearby seniors may be excited to occasionally watch the kids.
Seniors Empty nesters will be able to more easily downsize and also continue to age in the neighborhood. Nearby families can occasionally help with household chores.
All residents should benefit from interacting with others from a different age demographic.
City The housing variety should provide the city more stability from a number of perspectives such as consistent level of services needed by different demographics and consistent level of local sales tax
Developers Developers will need to put more thought into the design of buildings and developments. Construction costs may increase. To counter these increased costs options such as ADU and ½ size lots will increase the value of individual lots. Also, a balanced community should be attractive to potential residents which may increase the property values. Because of the diversity in housing sizes, the chance for complete failure due to the expected demographic not purchasing will be minimized.
Case Study
Additional Information
Problem Motivation
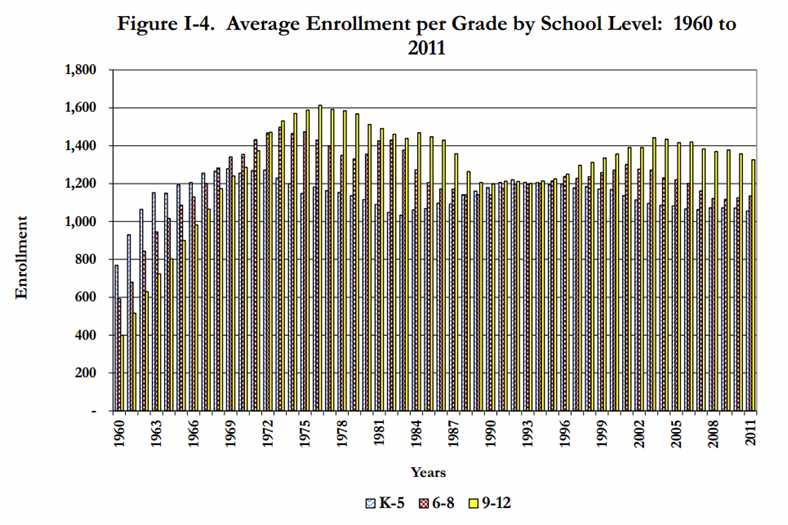
When looking at city services, do the needs fluctuate from decade to decade or half century to half century? For example, robust school enrollment followed by declining enrollment and then a rise in enrollment again. With the approaching "grey tsunami," the need for senior services will greatly increase. However, in roughly 40 years when the Boomer generation is mostly gone the need for the senior services will be reduced.
Littleton, located near Denver, has done a good job in making the city an enjoyable place to live. Many residents want to stay in the city as they age. However, a number of residents have expressed a desire to downsize their larger houses as they become empty nesters. The problem is limited housing options within city limits, much less within the family neighborhoods that they have grown to love. Thus, to downsize, they would have to move to a new neighborhood or out of the city. The challenges that Littleton faces is becoming more widespread among cities.
This lack of housing appealing to older adults appears to be a major reason for school enrollment fluctuation. The cycle of young families moving into newly constructed neighborhoods is reflected in school enrollment increasing. As the families age, the kids graduate and move out of the house, but the parents cannot downsize, which keeps the family house under occupied for 10, 20, 30 plus years. Can schools weather the long cycles of housing turnover to young families?
As a case example, the graph below shows the fluctuation of Littleton Public Schools enrollment.(1) In the last few years, Littleton did close 2 schools due to falling enrollment.